Public benchmarks are broken
TL;DR
- Public leaderboards answer one question well: broadly, how one model compares with another. They cannot tell you whether a model does your task.
- Five documented failure modes break published numbers: wrong gold labels (6.49 % of MMLU, 68.3 % of a SWE-bench sample filtered out), the prompt as a hidden variable (up to 76 points), comparisons without the power to detect what they claim (11 of 40 unresolved), contamination that can now be tested, and scores that describe a test set rather than a capability.
- Seven cheap changes fix most of it: publish intervals, correct for multiple comparisons, report prompt, sampling and dispersion, validate the grader first, audit the gold, treat the test set as a consumable, and add an adversarial session.
- If the decision matters, build the benchmark yourself, and apply the same seven changes to it.
A benchmark score travels much further than the evidence behind it. A number measured on a few hundred fixed items, under one prompt, graded one way, on a single day, ends up deciding which model goes into production and what a team builds on for the next year.
We spent several months reading the literature on how those numbers are produced — statistics, contamination, grader design, construct validity — while building an internal measurement protocol. The uncomfortable summary is that the field has documented, repeatedly and with data, that a large share of published comparisons cannot support the claims attached to them. Most of these findings are not new, not contested, and not obscure. They are simply not applied.
This post is the part of that reading worth sharing: what breaks, with the evidence, and what we think should change.
One clarification before the evidence, because the title is blunt and the argument is not. Public leaderboards are not useless — they answer one question well, and it is a real question: broadly, how does this model compare with that one? What they cannot answer is the question most teams actually have, and the rest of this post is about why.
Documented failureNo documented failureWhat breaks thereEvidence
What breaks there: the model has already seen them
Evidence: contaminationOren et al.
What breaks there: the reference answer is wrong
Evidence: 6.49 % error in MMLUGema, NAACL 2025
What breaks there: formatting alone moves the score
Evidence: up to 76 pointsSclar, ICLR 2024
What breaks there: the extractor fails silently
Evidence: ceiling / floor testsHow2Bench
What breaks there: no power to detect the claimed effect
Evidence: 11 of 40 unresolvedKotawala
5 of the 6 stages before it have a documented failure mode.
Underneath all of it: construct validity — a score is evidence that a model performs on a fixed item set, under one prompt, graded one way, on one day. Everything beyond that is inference.
Five of the seven stages have a documented, quantified failure mode. A number that survives all of them is rarer than the leaderboard suggests.
Part one — What the literature found
1. The gold labels are wrong more often than anyone budgets for
The reference answers themselves contain errors, and the rate is not marginal.
A 2025 audit of MMLU — one of the most cited benchmarks in the field — found a 6.49 % error rate after manual review of its questions and answers (Gema et al., Are We Done with MMLU?, NAACL 2025). The errors had been there for years, in a benchmark used in thousands of papers and dozens of launch announcements.
The agentic side is worse. When OpenAI ran a human annotation campaign over SWE-bench to produce SWE-bench Verified, the filtering removed 68.3 % of the sample they reviewed — problems that were underspecified, had broken tests, or could not be solved from the information given (Introducing SWE-bench Verified, OpenAI). That is not a rounding error in a widely adopted benchmark; that is most of it.
If the gold is wrong at a few percent, any comparison reporting a delta of a few points is reporting noise from the labels as if it were signal from the model.
- 6.49 %error rate in MMLU's questions and answers after manual reviewGema et al., NAACL 2025
- 68.3 %of a SWE-bench sample filtered out as unusable during human annotationOpenAI, SWE-bench Verified (2024)
- 76 pointsof accuracy movement from trivial prompt formatting alone, content untouchedSclar et al., ICLR 2024
Three numbers, three units. Presented as separate figures rather than bars on a shared axis, because a chart comparing an error rate to a filtering rate to an accuracy range would imply a relationship none of them have.
2. The prompt is a variable, and almost nobody reports it
This is the finding that surprises people most.
Trivial changes to prompt formatting — separators, capitalisation, spacing, with the content left untouched — move accuracy by up to 76 points on open models. The effect does not go away with more few-shot examples or with instruction tuning (Sclar et al., FormatSpread, ICLR 2024).
It is not only the absolute score. Changing the instruction template changes the ranking between models substantially (Mizrahi et al., State of What Art?, TACL 2024). Two labs evaluating the same models on the same benchmark with different templates can publish different winners, both correctly.
So a leaderboard row is not "model X scores N". It is "model X scores N under one prompt that usually is not published, and the number would move under another."
3. Most published comparisons cannot detect what they claim
This one is old and still ignored.
In 2020, an EMNLP paper showed that the majority of comparisons published in natural language processing lacked the statistical power for the effect sizes they claimed. Their worked example: evaluating machine translation with BLEU on a 2,000-sentence test set, the probability of detecting a real one-point improvement is about 75 % — even when that improvement genuinely exists (Card et al., With Little Power Comes Great Responsibility, EMNLP 2020).
It has not improved with scale. A recent analysis of the Open LLM Leaderboard v1 found that 11 of 40 published comparisons were not resolved — the design could not distinguish the effect being reported from noise — and that common shortcuts such as the Cohen-h formula underestimate the sample size needed, even with multiplicity correction applied (Kotawala, Resolution Diagnostics for Paired LLM Evaluation).
where d = share of items where the two arms disagree, N = items compared.
halving the effect you want to detect quadruples the items you need.
The minimum detectable effect of a paired comparison, and the same relationship solved for the sample size it demands.
At 10 % discordance — a typical value — the formula gives about 154 items to resolve a five-point difference, about 427 for three points, and about 3,800 for one point. Benchmarks are routinely sized for the first and used to argue the third.
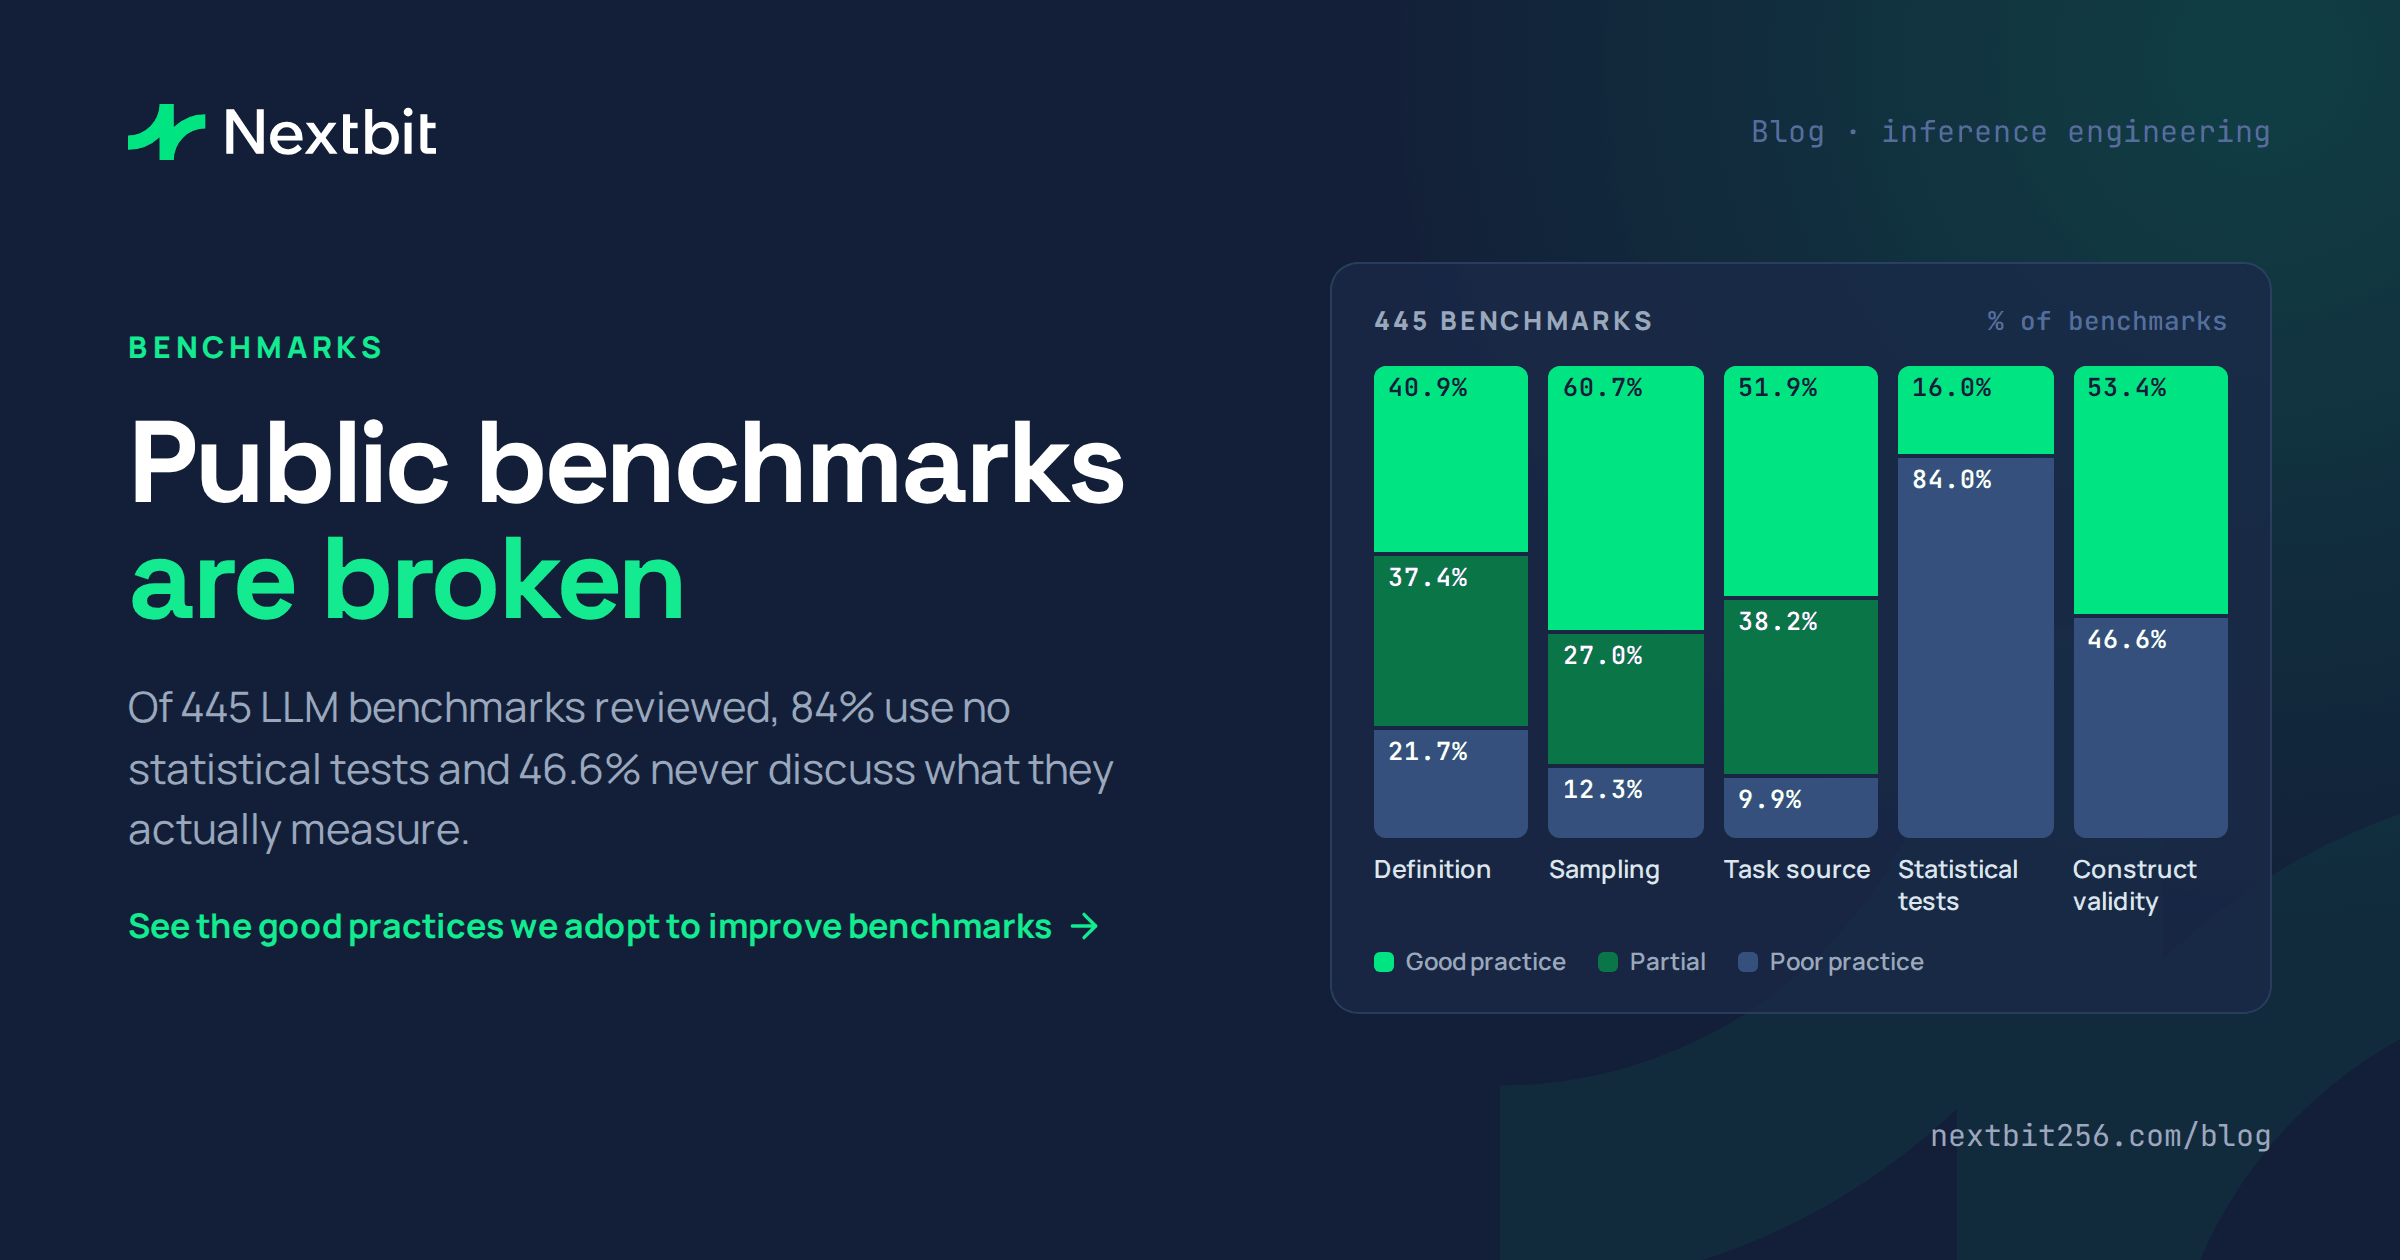
And almost nobody checks. In the largest review of benchmark practice to date, only 16.0 % of 445 benchmark papers conducted any statistical testing at all (Bean, Kearns, Romanou et al., NeurIPS 2025) — so for most published comparisons the question of whether the design could resolve the effect was never asked.
4. Contamination stopped being a suspicion and became a measurement
For years contamination was argued about rather than tested, because auditing a closed model's training corpus is impossible.
That is no longer the constraint. There is now a statistical test — an exchangeability test over the canonical ordering of the benchmark — that detects whether a black-box model has seen a test set, with no access to weights or training data, and it works on models of a few billion parameters with test sets of a few hundred items (Oren et al., Proving Test Set Contamination in Black Box Language Models).
The tooling exists. What is missing is the habit of running it before publishing a score, and of reporting the result either way.
5. The score describes a test set, not a capability
Underneath the other four sits a measurement problem that the field imported from the social sciences without importing its vocabulary.
The largest study of this to date screened 46,114 papers and reviewed 445 benchmark papers from ICML, ICLR, NeurIPS, ACL, NAACL and EMNLP against a 21-item codebook, annotated by 29 reviewers (Bean, Kearns, Romanou et al., Measuring what Matters: Construct Validity in Large Language Model Benchmarks, NeurIPS 2025). Its finding is structural: benchmarks routinely fail to establish that the thing they measure is the thing they name.
46,114
papers screened
ICML, ICLR, NeurIPS, ACL, NAACL and EMNLP
445
benchmark papers reviewed
0.96 % of those screened
One per benchmark, read in full.
21
codebook items
29 annotators scored construct validity item by item.
Finding: benchmarks routinely fail to establish that what they measure is what they name.
Source: Bean, Kearns, Romanou et al., NeurIPS 2025 Datasets and Benchmarks
View as table
| Definition of phenomenon | widely agreed | 40.9 % |
|---|---|---|
| contested | 37.4 % | |
| undefined | 21.7 % | |
| Use of convenience sampling | none | 60.7 % |
| partial | 27 % | |
| only convenience | 12.3 % | |
| Task source | not reused | 51.9 % |
| partially reused | 38.2 % | |
| only reused | 9.9 % | |
| Statistical tests | used | 16 % |
| not used | 84 % | |
| Construct validity | discussed | 53.4 % |
| not discussed | 46.6 % |
The fourth bar is the one that should stop a reader — 84 % ran no statistical test at all. Definitions fare little better: 37.4 % of the phenomena these benchmarks claim to measure are contested, and 21.7 % are never defined.
Source: Data from Figure 2, Key codebook results, in Bean, Kearns, Romanou et al., Measuring what Matters: Construct Validity in Large Language Model Benchmarks, NeurIPS 2025 (arXiv:2511.04703). Redrawn; the original is an alluvial diagram that also shows how the five items co-occur.
The framing that follows is worth internalising — evaluating generative systems is closer to a social-science measurement problem than to an engineering one (Wallach, Desai, Cooper et al., ICML 2025 Position Track). You are not reading an instrument off a machine. You are constructing a proxy for an abstract capability and hoping it holds.
Which means a benchmark result is evidence of one specific thing: that a model performs on a fixed set of items, under one prompt, graded by one grader, on one day. Everything beyond that is inference, and the inference needs its own argument.
Part two — Seven changes we would make
None of these require new science. All of them are things the literature already recommends and the practice does not do.
1. Publish the interval, never the point estimate
A score without its uncertainty is decorative. For paired comparisons this is a bootstrap over the discordant items and costs one afternoon of compute over results you already have (Miller, Adding Error Bars to Evals).
2. Declare the number of comparisons before running them, and correct for it
If you compare eleven categories, or four configurations, the threshold is not 0.05. Fix the count in advance, apply the correction, and report the corrected interval — not the uncorrected one next to a corrected p-value, which is the common half-measure and reads as significance that is not there.
3. Report the prompt and sampling parameters exactly as executed, and add a dispersion figure
Given FormatSpread, a single-prompt score is an anecdote. Running a subset of items under three paraphrases and reporting the spread alongside the mean costs very little and tells the reader how much of your number is the model and how much is your phrasing (Mizrahi et al.; see also PromptEval for doing this cheaply).
4. Validate the grader before the model
Every grader should ship with two tests: feed it the true answers and require 100 %, feed it garbage, empties and answers from other items and require 0 %. Write the tests before the grader. A silently broken extractor produces a clean-looking number that nobody questions.
5. Audit the gold and publish the error rate as a condition of the measurement
Given MMLU at 6.49 % and SWE-bench Verified filtering 68.3 %, a sampled audit of the reference answers is not paranoia, it is the cheapest quality control available. Report the rate you find, including when it is zero.
6. Treat the test set as a consumable
Every time you look at a held-out set, you spend some of it, and the leak travels through human decisions as well as through gradients — an engineer who fixes a prompt after looking at the failures has moved information from the test set into the system. Keep an explicit counter of queries per set, treat that count as part of the measurement, and retire the set when it is spent.
7. Pair the benchmark with an adversarial session designed to attack what changed
A few dozen questions, by hand, no automatic grader, chosen specifically to probe the behaviour the intervention just modified. This is the step that catches what no score can: failure modes outside the distribution the benchmark samples. It produces no headline figure, which is exactly why it gets skipped.
We checked this against our own work, and it holds
A survey of other people's benchmarks is easy to nod along to. So we ran the same questions over our own practice, auditing each experiment step by step against the protocol we had written. The panel below takes the seven best-validated of them: four benchmark evaluations of an open base model, and three LoRA adapters fine-tuned from it and measured against that same base.
The result is uncomfortable in a specific way. We were not careless on the axes that are easy to care about, and we were empty on exactly the axes the survey says everyone is empty on.
View as table
| 445 published benchmarks | Us | |
|---|---|---|
| Statistical test on the comparison | 16 % | 100 % |
| Construct validity addressed | 53.4 % | 75 % |
| Phenomenon defined and agreed | 40.9 % | 75 % |
Source: Bean, Kearns, Romanou et al., NeurIPS 2025 (445 benchmarks). Us: audit of our own experiments against the same codebook, 3 of 3 comparisons and 3 of 4 evaluations. (2026-09)
What public benchmarks are for, and what they are not
Public leaderboards are a comparison instrument. They tell you, broadly, how one model sits relative to another across a wide spread of tasks, and that is genuinely useful when you are choosing where to start looking, tracking whether the field is moving, or ruling out a model that is two tiers below what you need.
They cannot tell you whether a model does your task. Not because the people who build them are careless, but because of what they are: a fixed set of items, bounded and cheap to grade because they have to be, scored under one prompt on one day. Your work has messy inputs, ambiguity, multi-step flows, tools, and a standard of correctness that someone in your organisation defines. None of that is in the leaderboard, and no amount of reading the leaderboard more carefully will put it there.
So if the decision matters — which model goes into production, whether a fine-tune was worth it, whether the new release is actually better for you — the honest answer is that you have to build the benchmark yourself. Your items, your reference answers, graded the way you would grade a person doing the job.
That is a smaller undertaking than it sounds. A few hundred real cases, with gold written by somebody who knows what good looks like, will tell you more about a model's fit for your work than any public score, and it keeps telling you as models change. The expensive part is not building it; it is the discipline to keep it frozen once you have.
And the seven changes above apply to it in full. Building your own benchmark fixes representativeness — the tasks are now the real ones — but it fixes nothing else. Your gold labels can be wrong, your prompt is still a hidden variable, your sample may still be too small to resolve the difference you are about to act on, and your grader can still fail silently. Domain relevance and measurement quality are two different problems, and the second is the cheaper of the two: most of what is listed above costs hours of analysis over data you already have, not new evaluation runs.
Where this goes
If you want to learn more about how to benchmark your own use case, follow along — we'll be publishing more.
Sources, and what we have and have not verified
Everything cited here is published work, linked to its venue and year in the text. The findings we report are theirs, not ours: we have not reproduced the MMLU audit, the FormatSpread sweep, the Open LLM Leaderboard resolution analysis or the contamination test. What we have done is apply their recommendations to our own measurement practice and find out which are cheap and which are not — the seven above are the ones we consider both cheap and load-bearing.
Primary references: Bean, Kearns, Romanou et al. (NeurIPS 2025) · Wallach, Desai, Cooper et al. (ICML 2025) · Gema, Leang, Hong et al. (NAACL 2025) · Sclar, Choi, Tsvetkov, Suhr (ICLR 2024) · Mizrahi, Kaplan, Malkin et al. (TACL 2024) · Card, Henderson, Khandelwal et al. (EMNLP 2020) · Kotawala, Resolution Diagnostics for Paired LLM Evaluation · Neuhof and Benjamini, Quantifying Ranking Uncertainty in LLM Benchmarks · Mandujano Reyes, Statistical Methods for Multiple Language Model Comparison · Oren, Meister, Chatterji et al., Proving Test Set Contamination in Black Box Language Models · Miller, Adding Error Bars to Evals · OpenAI, Introducing SWE-bench Verified · Reuel, Hardy, Smith et al., BetterBench (NeurIPS 2024).